Welcome to the SR20 Community Forum - The Dash.
Register
SR20 forum logo

Thread: How to make your fuel and timing maps AKA "TP/LOAD" scales

+ Reply To Thread
Posts: 161-170 of 193
2013-03-01 19:00:26
#161
Originally Posted by UNISA
Originally Posted by wnwright
Originally Posted by BenFenner
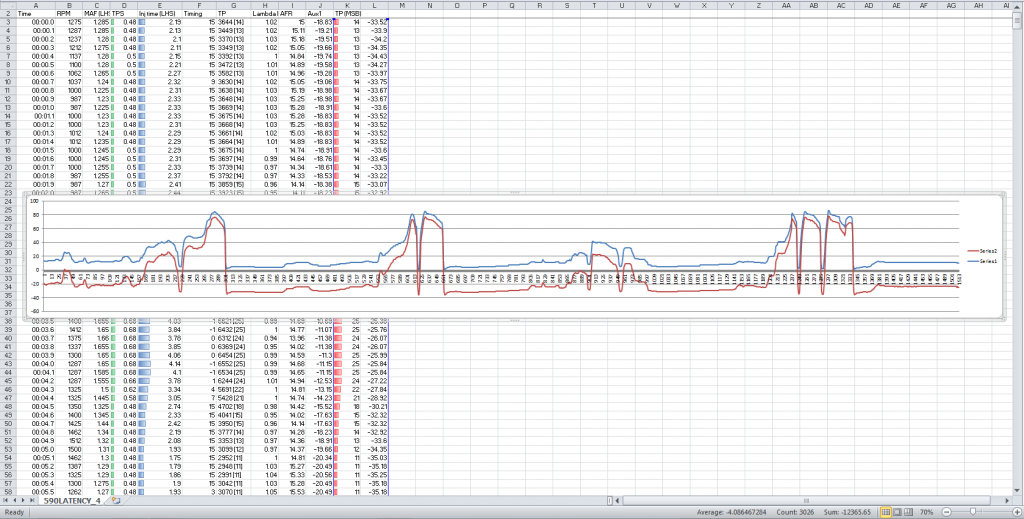
The text in this picture makes me wonder where you're getting your MAP signal from, since you seem to think you can throw away some data?


Earlier he said he had delay... If that is true ALL rows of the MAP sensor data should be shifted to correct. That picture sure looks like somewhere around 0.2 second delay.


Look at the closed TPS .48v reading and then notice injection time plumits down basically instantaneous, there is no delay here in this log and that is very telling, come on were dealing with .x (tenths of a second) and dont forget interpolation of whole number plots and whole number plots plus hundreths place.


You have to understand... A part of my day job is data collection and analysis... We deal in microseconds or at worst milliseconds.... 100 milliseconds is a long time to me.

I am looking at the TPS... row 303 you are at zero. I made the assumption that MAP sensor data is the AUX1 column and it is very clearly 0.2ms behind with full vacuum at 305. The manifold pressure that I see changes in ~50-60 microseconds normally with full closed throttle to full vacuum. Since yours is gradual it should be as fast or faster.
2013-03-01 19:05:53
#162
Originally Posted by OnTheChip
Here are some scatter plots of MAP vs. TP and MAP vs. MAF Q. These were made using over 15000 data points collected over a 30 minute drive with varying load, rpm, throttle and speed conditions.

Dave


This is my TP vs MAP its the same thing as Mr. Dave's excpet mines over 2min 32 seconds and the "anomalies" (where the graph doesnt match is mostly at positions of closed throttle) on Mr. Daves these are the way off scatter marks same stuff Tomato Tomäto

2013-03-01 19:10:50
#163
I'm getting a little tired of making the same points over and over again. If there is nothing really new added to this conversation I won't be back here to pull things apart. Your latest comment is filled with so many holes. The problem is, they take a lot of time to explain. I don't have that time right now. I will give it my best real quick here.

Originally Posted by UNISA
TPS is fine buddy, trust me
You said TPS data was inconsistent and to ignore it. It also looks completely fucked from your logs. Is it fine, or is it fucked? It can't be both.

Originally Posted by UNISA
honestly you should hook up a MAP sensor and log with it a while
Honestly you should read my posts a little closer and do try to remember you're talking to the same person who said this earlier:

Originally Posted by BenFenner
Originally Posted by UNISA
ARE ANY OF YOU LOGGING WITH A MAP SENSOR? ANY OF YOU? DIDNT THINK SO OR ELSE YOU ALL WOULD BE TELLING ME NO SHIT!
I am logging with a MAP sensor.

However, I have no way to log TP, otherwise I'd have the graphs posted already.


Pro Tip: You can tell me from everyone else on the forum based on my username, and avatar.


Originally Posted by UNISA
and you would see how it correlates to TP on a daily basis, its not off in that huge range your giving it,
That is not true. TP does not correlate with pressure, and it is off in that huge range I'm giving it. Dave's scatter plot is quite good at showing how fucking huge the swings are in TP in relation to pressure. Those aren't all just stray data points. They describe a huge island where TP and pressure can swing around by 50+% independent of each other.

I completely understand why you think they are so closely linked, because of all these logs you're posting. It seems very convincing. Your problem is that your engine doesn't rev high enough, and/or won't keep a steady pressure long enough to show the difference. And again, it is not a tiny thing.

Originally Posted by UNISA
if that where the case that stock ECU would have to modiify the TP colums on the fly so that it accessed the right parts of the maps and that it does not do.
No. For fuck's sake no. Jesus Christ, this is not a fucking speed density setup. Get that through your thick skull. The ECU doesn't have to do any such thing. If the designers wanted pressure, they'd put in a damn pressure sensor. The designers don't give a shit about pressure, and neither should you. You have a MAF sensor, and it literally reads incoming air molecules. With the known 20% oxygen content of air in the Troposphere you can get an exact measurement of the mass of oxygen molecules entering the intake at any time. Take that data and divide it by the current engine RPM and you now know how much torque the engine should be making. Take that and divide it by the number of cylinders, and you have an estimation for how much fuel is needed for a single cylinder. Do a one-time scaling for your choice of injector and you're HOME FREE! No need to ever ever ever ever know anything about pressure.

For the record, the best guess we have for the TP formula is this:

TP = (VQ · K value / CAS value) / Number of cylinders

VQ comes from the MAF look-up table and CAS is the Cam Angle Sensor reported RPM divided by 50 then multiplied by 256.


Supposedly it is not perfect, but it is damn close plus or minus other trim factors.
Reference: http://www.ztechz.net/id10.html


How on God's green Earth you figure TP has anything to do with pressure is beyond me. It really is. You also don't seem to get the concept that it is perfectly possible to control an engine without ever having even the faintest concept of what pressure is. STOP THINKING ABOUT SPEED DENSITY FOR ONE SECOND and work with a clean slate.
Last edited by BenFenner on 2013-03-01 at 19-21-18.
2013-03-01 19:13:02
#164
Originally Posted by wnwright
Originally Posted by UNISA
Originally Posted by wnwright
Originally Posted by BenFenner
The text in this picture makes me wonder where you're getting your MAP signal from, since you seem to think you can throw away some data?


Earlier he said he had delay... If that is true ALL rows of the MAP sensor data should be shifted to correct. That picture sure looks like somewhere around 0.2 second delay.


Look at the closed TPS .48v reading and then notice injection time plumits down basically instantaneous, there is no delay here in this log and that is very telling, come on were dealing with .x (tenths of a second) and dont forget interpolation of whole number plots and whole number plots plus hundreths place.


You have to understand... A part of my day job is data collection and analysis... We deal in microseconds or at worst milliseconds.... 100 milliseconds is a long time to me.

I am looking at the TPS... row 303 you are at zero. I made the assumption that MAP sensor data is the AUX1 column and it is very clearly 0.2ms behind with full vacuum at 305. The manifold pressure that I see changes in ~50-60 microseconds normally with full closed throttle to full vacuum. Since yours is gradual it should be as fast or faster.


Aux 1 is BOOST

I totally understand....but we are trying to line up digital on digital data (TPS)(TP), to digital on digital data that is waiting for a signal from atmosphere (MAP), theres a relay runner waiting for the "baton" so its gonna be a little off but for intended purposes this is plenty close enough. Turbos have to spool down, BOV have to finish venting, throttle blade has to close 100%, there alot of residual left over.
2013-03-01 19:14:51
#165
TPS was fine for these logs I been posting just not the very first ones on like page 1 its fine Benn I had to set the TPS idle memory that is all its a brand new TPS.
2013-03-01 19:30:43
#166
Understood about the TPS.


The place where you will see repeatable, undeniable, and relevant (since it seems tuning under power is your thing) differences in TP and MAP is after torque peak to redline. For whatever reason, out of all of your logs, you seem to stop before the real differences start showing up. I know you're doing a good bit on your own time and for very little self gain, so I'm not going to ask you to do more...
But if it were me, I'd be doing WOT runs to redline. WOT from down low to redline. No mistake about it. None of this BS 1/2 throttle crap. Bounce off that limiter at WOT once for a real log. What is your redline anyway?

(Since your car is boosted we can't use below torque peak like we could with an N/A car to show the discrepancy clearly because the turbo messes with pressure down there making it hard to see clear as day like you can after torque peak.)
Last edited by BenFenner on 2013-03-01 at 20-39-38.
2013-03-01 19:59:53
#167
Originally Posted by UNISA
Originally Posted by wnwright
Originally Posted by UNISA
Originally Posted by wnwright
Originally Posted by BenFenner
The text in this picture makes me wonder where you're getting your MAP signal from, since you seem to think you can throw away some data?


Earlier he said he had delay... If that is true ALL rows of the MAP sensor data should be shifted to correct. That picture sure looks like somewhere around 0.2 second delay.


Look at the closed TPS .48v reading and then notice injection time plumits down basically instantaneous, there is no delay here in this log and that is very telling, come on were dealing with .x (tenths of a second) and dont forget interpolation of whole number plots and whole number plots plus hundreths place.


You have to understand... A part of my day job is data collection and analysis... We deal in microseconds or at worst milliseconds.... 100 milliseconds is a long time to me.

I am looking at the TPS... row 303 you are at zero. I made the assumption that MAP sensor data is the AUX1 column and it is very clearly 0.2ms behind with full vacuum at 305. The manifold pressure that I see changes in ~50-60 microseconds normally with full closed throttle to full vacuum. Since yours is gradual it should be as fast or faster.


Aux 1 is BOOST

I totally understand....but we are trying to line up digital on digital data (TPS)(TP), to digital on digital data that is waiting for a signal from atmosphere (MAP), theres a relay runner waiting for the "baton" so its gonna be a little off but for intended purposes this is plenty close enough. Turbos have to spool down, BOV have to finish venting, throttle blade has to close 100%, there alot of residual left over.


Edit nevermind... I give up trying to share knowledge. I have experience with there being a delay there due to how the data enters the stream, but whatever believe what you want.
Last edited by wnwright on 2013-03-01 at 20-12-09.
2013-03-01 20:10:15
#168
Originally Posted by wnwright
Originally Posted by UNISA
Originally Posted by wnwright
Originally Posted by UNISA
Originally Posted by wnwright
Originally Posted by BenFenner
The text in this picture makes me wonder where you're getting your MAP signal from, since you seem to think you can throw away some data?


Earlier he said he had delay... If that is true ALL rows of the MAP sensor data should be shifted to correct. That picture sure looks like somewhere around 0.2 second delay.


Look at the closed TPS .48v reading and then notice injection time plumits down basically instantaneous, there is no delay here in this log and that is very telling, come on were dealing with .x (tenths of a second) and dont forget interpolation of whole number plots and whole number plots plus hundreths place.


You have to understand... A part of my day job is data collection and analysis... We deal in microseconds or at worst milliseconds.... 100 milliseconds is a long time to me.

I am looking at the TPS... row 303 you are at zero. I made the assumption that MAP sensor data is the AUX1 column and it is very clearly 0.2ms behind with full vacuum at 305. The manifold pressure that I see changes in ~50-60 microseconds normally with full closed throttle to full vacuum. Since yours is gradual it should be as fast or faster.


Aux 1 is BOOST

I totally understand....but we are trying to line up digital on digital data (TPS)(TP), to digital on digital data that is waiting for a signal from atmosphere (MAP), theres a relay runner waiting for the "baton" so its gonna be a little off but for intended purposes this is plenty close enough. Turbos have to spool down, BOV have to finish venting, throttle blade has to close 100%, there alot of residual left over.


Right... but that "little off" is a little off which is my ONLY point.... and it is true for every row. I was basing the throttle closed measurement... which means it is already closed. Your plenum/runner volume should be consumed in less than 80ms at ~6500rpm assuming a somewhat stock plenum/runner size. Has nothing to do with spool down or venting. You can run without a BOV and see the MAP sensor response is nearly unchanged. The throttle plate controls manifold pressure with good authority. I see better manifold response to throttle close and I am forcing ~350cfm of air at a closed throttle plate causing pressure to spikes to 30-35psi (depending on RPM) just on the other side of the throttle plate.


If there is lag (which it looks like there is) it is due to the sensor you are using sampling over time before returning or the A-Ds which will be consistent delay for all data (I haven't used the sensors or way you are so I don't know where it is introducing error). Since it is "back-doored" into the log I am pointing out there is a discrepency by ~2 rows when you are comparing data based on my previous experience with low latency sensors.


Ok well there is a marrying of 2 devices at hand

One is the Nistune ECU and the other is the Innovate LM-2 which has auxilary inputs that allows me to add a map sensor and log that into Nistune and inject it into the consult data stream now what happens from there on out ?

And by the way I didnt snap the throttle shut on purpose for this log i rolled off it slower but it was still abrupt but just not total lift off, all other instances it looks alot different in the log.
Last edited by UNISA JECS on 2013-03-01 at 20-13-33.
2013-03-01 20:36:02
#169
Originally Posted by BenFenner
Understood about the TPS.


The place where you will see repeatable, undeniable, and relevant (since in seems tuning under power is your thing) differences in TP and MAP is after torque peak to redline. For whatever reason, out of all of your logs, you seem to stop before the real differences start showing up. I know you're doing a good bit on your own time and for very little self gain, so I'm not going to ask you to do more...
But if it were me, I'd be doing WOT runs to redline. WOT from down low to redline. No mistake about it. None of this BS 1/2 throttle crap. Bounce off that limiter at WOT once for a real log. What is your redline anyway?

(Since your car is boosted we can't use below torque peak like we could with an N/A car to show the discrepancy clearly because the turbo messes with pressure down there making it hard to see clear as day like you can after torque peak.)


I do the half throttle crap because im fine tunning transitional periods and peroids were VE is really high and leaness is likely to occur and knowning these funky areas help with throttle responce.

I'll do what I can I dont mind doing pulls around the street in my car time permitted.

I just made this for quick reference for my logs these should fall into place moreless and what wnwright mentioned about the log being off (time wise) looks right and being that the MAP is the external sensor being pluged into the data stream from another source is probably right, now to adjust this and see how things line up.

46-52 TP = 0-1 PSI

52-57 TP = 1-2 PSI

57-63 TP = 2-3PSI

63-69 TP = 3-4PSI

69 - 74 TP = 4-5PSI

74 - 80 TP = 5-6PSI

80 - 86 TP - 6-7PSI
Last edited by UNISA JECS on 2013-03-01 at 20-47-29.
2013-03-01 20:58:31
#170
Originally Posted by OnTheChip
Ben, you're right, you can't use one to calculate the other exactly, but Mr. JECS is right in that they trend together and can be "ball-parked" for his purposes of getting a general indication of where off-boost, boost transition, and on-boost are in his fuel map. That's all he and, VAD, and JK are saying.


X2, that’s how I would sum up this whole thread.

Originally I had a problem Jecs was implying: (X)TP = (X) PSI
But since then, I think he has changed his mind. I have no problem with the below statement.

Originally Posted by UNISA
TP is interperlated from whole numbers, BOOST is being logged by the hundreth place therefore a range of TP (#-#) is equal to a BOOST pressure, its just a range you cannot name one TP # as and exact PSI, lets not get technically here cause it would be a waste of time and look what wear dealing with here logging up to the .xx (hundeth) place, yea thats a headache trying to specifically match that to a whole number TP lol.


I am in agreement with the above statement. I don’t think anybody is disagreeing with a trend with Boost/PSI and TP, based on Jecs’s logs.

The only person I see here that is still “hanging on to bone” is Benfenner. Benfenner, I think you are nickpicking Jecs’s data. Jecs has already conceded X boost is not equal to X TP. Now you need to concede to him there is a trend and range.


Originally Posted by BenFenner

There is no reason to know or care what pressure you idle with, or where 100 kPa is, or where your max boost pressure is when working with TP. There is no reason to care about pressures at all, ever. Trying to put pressure into the mix is a sign to me that someone hasn't grasped what TP is all about. If one is to tune with mass air, I'd say it would behoove them to understand it intrinsically and quickly ditch any attempt at relating it to speed density. If I were teaching someone how to tune with mass air, I would never mention pressures, whether they were a novice or already familiar with speed density. I believe it would only confuse the matter, and send them down the wrong path.


I agree with this statement. That is why I have said logging Vacuum/Boost is redundant. The TP log has already given you a range for the TP scale.
+ Reply To Thread
  • [Type to search users.]
  • Quick Reply
    Thread Information
    There are currently ? users browsing this thread. (? members & ? guests)
    StubUserName

    Back to top