Welcome to the SR20 Community Forum - The Dash.
Register
SR20 forum logo

Thread: Tuning Saga: A Love Story About a Man and His Daughterboard

+ Reply To Thread
Posts: 1-10 of 40
2008-01-04 17:30:08
#1
Tuning Saga: A Love Story About a Man and His Daughterboard
This is a renovation and continuation of a post first made by me on another SR20 Forum.

Initial Assessment

After more than a year of collecting dust, my Calum daughterboard ECU is now actually IN the car. I drove for a week with the Innovate! AFR as my copilot to assess the fuel mixture and general behavior of the ECU. I am using Calum's SR20DE tune version 4 on my 1991 Classic with AEM CAI, TopSpeed Header and fuel pressure set a 44 psi (with the vacuum hose removed and plugged).

Here is what I have found:

1. The car drives well -- no roughness (after I changed timing from 19*BTDC to 15* BTDC and opened the IAV screw by a quarter turn to restore the idle).
2. The car feels peppier -- pulls nice from mid to high RPM. Can't wait to get it on the dyno.
3. Idle AFR is rich -- 12.5 after full warm up.
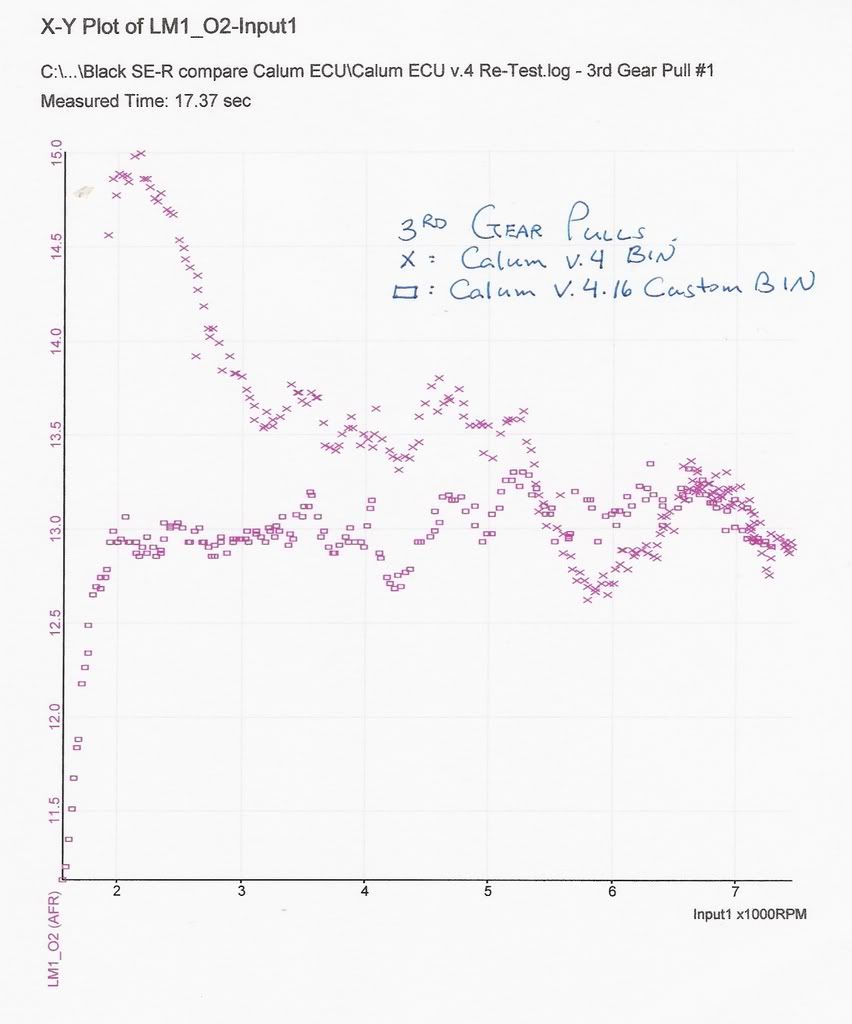
4. WOT AFR is rich -- 12.5 on a long pull in 3rd, drifting up toward 12.7 at 7000RPM.
5. Light throttle AFR is rich -- 13.5 at steady speed
6. The car still got 33 MPG in mixed driving even though it is running a little rich.

I do not think that the feedback loop is working to maintain 14.7 at idle and light throttle.

I ran an Active Test with Nissan DataScan with the fuel delivery cut to 90% of what the ECU was trying to deliver. This accomplished the following:

1. Idle AFR increased from 12.5 to 14
2. WOT AFR increase from 12.5 to 13.5-13.7

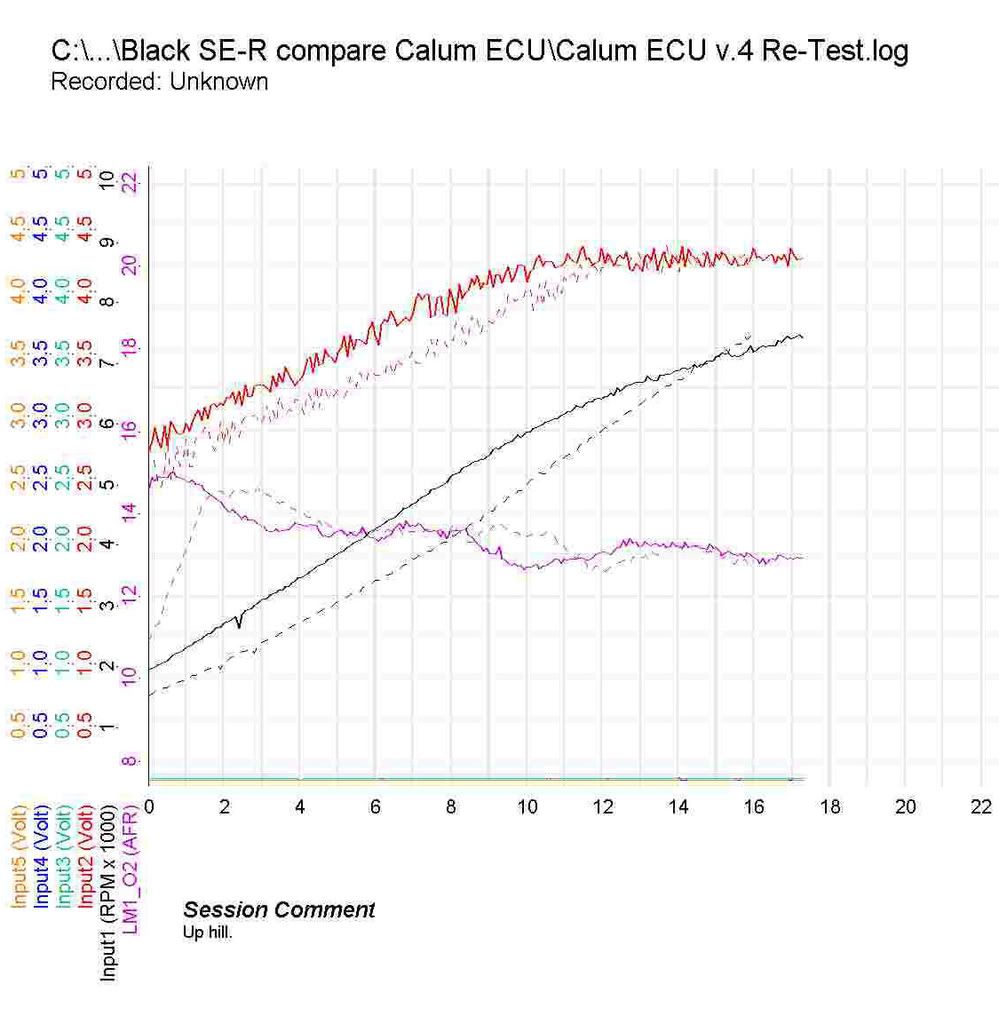
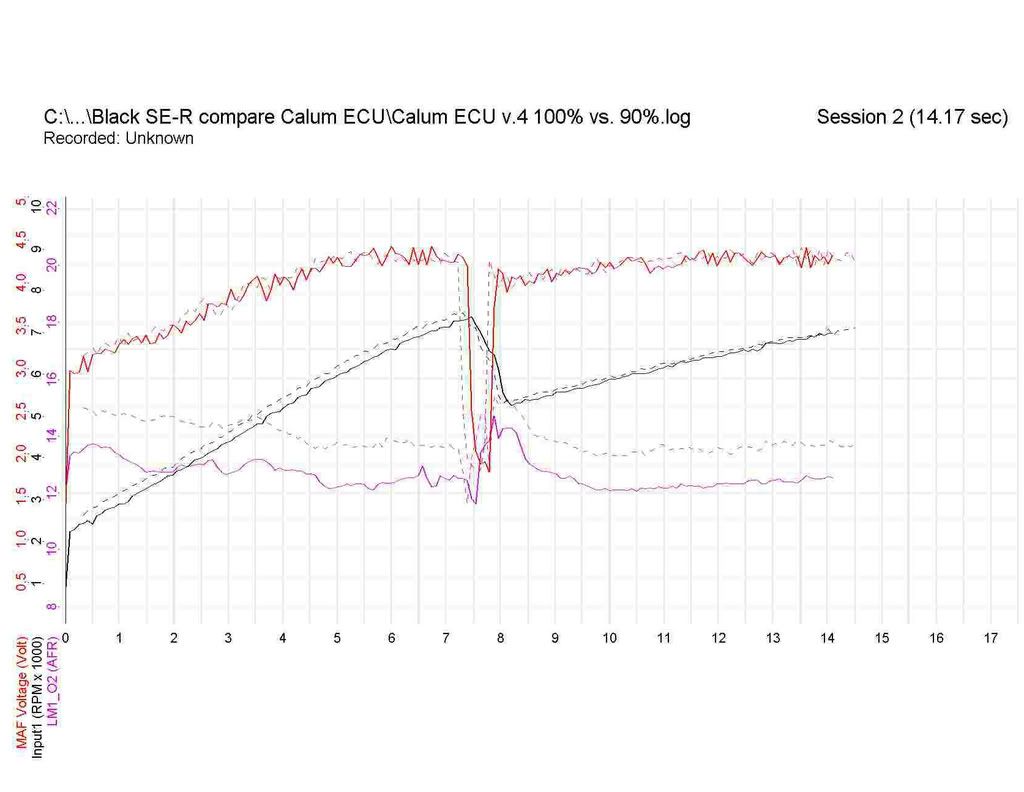
Here is a display of data collected by the Innovate LM-1 during a run through 2nd and 3rd gears. The dashed lines show the test with 90% fuel delivery using Nissan DataScan active test, the solid lines are 100% fuel delivery. Black lines are RPM, purple are AFR, and the red is MAF voltage, all plotted against seconds.


How should I proceed?

Should I reduce the K value by about 15% to try and adjust the idle mixture to 14.7? This will make other areas of the fuel map too lean and so then I would have to go back and increase individual cells.

OR

Should I reduce the K value (about 7%) to tune in the WOT AFR to 13.3-13.5 and live with the idle?

OR

Should I try some other approach like adjusting the individual values in the fuel map?

I'm new to this stuff, so any suggestions are welcome.

Bill
2008-01-04 17:36:57
#2
Setting Up Closed Loop Idle by Editing the Fuel Map

OK, so I’ve been reading and experimenting and making some progress. Maybe it will help some others who are just starting out to hear about what I’ve been doing. My progress has been slow because I have been out of town on business and deprived of my cars, but I’ve gained some fundamental understanding and successfully corrected my AFR at idle.

First, I got the Nissan Datascan Map Trace Function working. I set it for the fuel map, rather than the timing map, because that’s what I need to be working with. I used the inputs that Calum provided for the B13:

RPM MSB - 4475
RPM LSB - 4474
TP - 4292

Fuel Map - 8100
TP Scale (fuel) - 80F0
RPM Scale (fuel) - 80E0

(and when it's time)
Timing Map - 8D00
TP Scale (timing) - 8490
RPM Scale (timing) - 8480

OK, so the Map Trace showed me that when the car is idling, it is pulling the fuel correction factor from fuel map cell 1000 RPMx20 on the load scale. For this bin file, the location is the top row, third column from the left. I also got a good idea of where the ECU reads from for light throttle application (upper few rows left of center) and WOT (totally in the far right column).

For the “idle” cell (1000x20), the value on the map is “3.” I found a posting on another forum that explained what this means. The value is a correction factor that is applied to the basic pulse width calculated for an AFR of 14.7 (which is called “stoich” -- the correct ratio for complete combustion of gasoline based on the chemistry of the fuel). To calculate the basic injector pulse for “stoich” the ECU uses K – a parameter that is entered into the bin based on injector flow, and the MAF voltage converted into a flow quotient estimate using the VQ map for the MAF that is being used. The VQ map relates the MAF voltage to the air flow to generate the column headings that we see in ROM Editor (i.e., 8,16,20, 24…80 – it works for me to think of these as % flow based on the actual MAF voltage reading and the maximum MAF voltage reading possible).

OK, so I said the value in the fuel map was “3” for the idle cell. What does this mean? If I reduce it to “1” do I cut the fuel by two thirds? What about if I enter “0,” will I get any fuel at all? The posting that I mentioned above from the other forum gave me a way to noodle through these questions. Here is how to calculate the injector pulse duration correction factor (multiplier) based on the value in the fuel map:

If the MAP VALUE is less than 128, then MULTIPLIER = (DATA + 128)/128
If the MAP VALUE is greater than 128, then MULTIPLIER = (DATA – 64)/128

I set up an excel spreadsheet to calculate the MULTIPLIERS for me based on the MAP VALUES. For a map value of “0” we can calculate that the multiplier would be “1.00” using the first equation above. For a map value of 3 we see that the multiplier is 1.02. To get multipliers less than “1” we need to enter values greater than “128.” For example, a value of 160 gives a multiplier of 0.75, and for 192, the multiplier is “1” again. Values higher than “192” have multipliers greater than “1.” Kind of weird, but workable.

Now I was ready to change the fuel map to fix my rich idle. After warm up, my idle was about 12.5 AFR with a map value of “3.” (multiplier of 1.02). I wanted to move it to 14.7, or 2.2 AFR units. To figure out how much to reduce the fuel flow multiplier, I divided 2.2 by 12.5 to get a 17% decrease in fuel delivery, or 83% of the original multiplier. 0.83 x 1.02 = 0.85, the new multiplier that I would want to use for this cell. Using the formula above, a map value of 173 gives us a multiplier of 0.85.

So I entered “173” in the idle cell. I also entered the same value in adjacent cells to smooth things out, and then “0” in the next rank of cells to transition back to the value of “3.”

I burned my first 2 chips with the new program and installed them in the ECU. The ZIF sockets are really nice – I just pulled the ECU over near the accelerator pedal, removed the top, and swapped the chips, making sure to put them in the correct orientation. For convenience, I will leave the top off the ECU until I am done with tuning.

Now, the moment of truth: Turn the ignition key. The fuel pump hummed, the car started and ran fine. After warm up, the idle was corrected to a nice oscillation around 14.7. Just changing these cells and increasing the Feedback Control in the Global Map from FO (240dec) to F5 (245dec) not only corrected the idle, but also put the light throttle AFR under 3000 RPM into the closed loop area and it is no longer rich, but running at 14.7. After a week of driving, I have experienced no drivability issues and still got 30 MPH in a lot of stop-and-go rush hour driving.

I plan to use Map Tracer to determine how many more cells to give this treatment to get a more complete resolution of the light throttle richness. And finally, I will address the richness at WOT and high RPM. Then I will be ready for the dyno. I plan to play with the timing map a little and then do a back to back comparison of the OEM tune with the Calum tune.
2008-01-04 17:38:23
#3
Setting Up Closed Loop for Light Throttle

Here’s more of my long story, but let me remind you that this is the first time that I’ve done anything like this. What you see here is just my description of how I am proceeding – not in any way a recommendation on the best way to get it done. I’m still looking for input on how to do this. With that in mind, here is some more of my story.


OK, so after successfully getting the idle in closed loop, I wanted to work on the light throttle portions of the fuel map. I was running rich here, and found that Calum’s NA B13 v.4 tune eliminates the O2 feedback or closed loop feature of the normal factory tune. The factory ECU provides a tune in which a large part of the fuel map – lower RPMs and air flows – uses the O2 sensor to richen or lean out the mixture to maintain an AFR of 14.7 (again, this is the stoichiometric ratio, or the perfect mix based on the chemical makeup of the fuel for gasoline to burn with nothing left over,).

In ROM Editor, the closed loop values are the “higher” set of values. That is, using the formulas that I provided in my last post, the fuel map gives a pulse width correction factor of “1.00” for an entry of either “0” or “192.” If you enter “0” the ECU will be in open loop when it is reading that cell, and if you enter “192” the ECU will be in closed loop mode when it is reading that cell. According to Calum’s postings, as long as your “high” range value is “close to” stoich, the closed loop will be able to dial it in to 14.7 – you can watch your AFR data cycle around 14.7 when you are in closed loop. I’m not really sure how close it needs to be. The high range (closed loop) values in the fuel map are easily identified because they turn the cell blue, the lower values are shades of red.

So, my first task was to identify which cells of the fuel map I wanted to put in closed loop mode. To do this, I used ROM Editor to look at the factory tune BIN file that I had pulled from my own 1991 SE-R using DataScan. I found that the following cells are in closed loop from the factory: 600-1600 RPM and 8-48 flow quotient; 2000 to 3600 RPM and 8-56 flow quotient; 4000 RPM and 8-48 flow quotient; 4400 RPM and 8-40 flow quotient; 4800 RPM and 8-32 flow quotient; and 5200 RPM and 8-24 flow quotient.

Then I went to Calum’s BIN file for the v.4 tune to locate the comparable cells in his fuel map. The first thing I noticed was that Calum changed the RPM scale to extend it to higher RPMs and give finer resolution to the tune at higher RPMs. Smart fellow! To do this, he had to sacrifice the fineness of the tune at lower RPMs. So, where the factory tune has a row for 600, 800, 1200, 1600 and 2000 RPM, Calum’s map has rows at 1000 and 2000. But the factory tune stops at 6400 and Calum’s extends to 6800, 7200, and 7600 RPM. Since Calum’s map has the lower RPM rows scrunched together, there are a lot fewer closed loop cells to deal with. Here are the ones I decided to target for closed loop: 1000 RPM with flow quotients of 8-48; 2000-4000 RPM with flow quotients of 8-56; 4600 RPM at 8-32; and 5200 RPM at 8-24. I made up an excel spreadsheet with these cells laid out and printed a copy big enough so that I could put it on a clip board and take it out on the road with Map Tracer and note the AFRs that I would get in each cell. Using this information I could calculate the “blue” numbers needed to get me close to 14.7 and into the closed loop cycle by using the same equations that I used to set up the closed loop idle.

So out on the road I went with my clipboard and laptop set up for Map Trace in Nissan DataScan. I cruised up and down the interstate dialing in the appropriate cells with throttle application and noting the AFR on the clipboard. I noticed that the AFR would change within the cell range depending on RPM – that is to say it was different at 2100 RPM than at 2900 RPM, even though the ECU was reading from the same cell in the fuel map. Once I noticed this, I started to read the AFRs in the middle of the RPM range for a given cell and this gave me much more consistency. I used lower gears to access the higher RPM cells and found that this worked fine. The range of cells that I identified would allow you to cruise in closed loop up to 75 mph – plenty for most driving conditions.

A word of caution: I was able to do this without running into the rear of another car, or off the road, but it sure would be safer and easier to do it with a helper. There is a lot going on with watching the Map Tracer, modulating the throttle, watching the tach, reading the AFR and writing it on the clipboard! You could also do this on a dyno.

Most of the AFR readings that I read from Calum’s NA v.4 tune for my car under these conditions were in the high 12s or low to mid 13s. So, I took this information back to ROM Editor and individually leaned out each cell an appropriate amount and entered the “high” or “blue” number into the fuel map. Then I saved my new tune and burned new chips and swapped them into the daughterboard as before.

Amazingly, the car started and ran again! Driving it around, I was pleased to find that my new chips were keeping the car in closed loop, showing AFR vacillating around 14.7 under all light throttle conditions. This was leaner than I was seeing with the original Calum tune, which was giving me 13-13.5 under these same conditions. I also noticed the ECU learning the new tune – as I drove more, the AFR became steadier under closed loop. My first tank of gas with this tune gave me 34.7 mpg in mixed driving, but this seems almost too good to be true, and I will check it again to confirm.

I want to mention one more thing. I have developed an EXCEL spreadsheet that calculates the fuel correction factor from the map data value using the equations in my last post. You plug in the map value and it gives you the correction factor to the pulse width and the equivalent closed loop value (blue cell value). This makes it easy to figure out what numbers to enter into the fuel map. I also made a hex-dec converter in an EXCEL spreadsheet. I do not know how to (or whether I can) post these files here, but will be happy to send them to you via email if you just ask for them through pm or email.

Next I will move on to the high flow quotient columns (far right side of the map).
2008-01-04 17:39:21
#4
Tuning the WOT Portion of the Fuel Map


I’ve spent a lot of time trying to fine tune the WOT AFR starting with Calum’s SR20DE v.4 bin. In fact, I have burned and tested more than 20 different versions of the BIN. I am getting quite good at swapping out the chips in the ECU. I am so quick that my knees don’t even get dirty any more! Guys – get the RealTime version of the daughterboard if you are going to get into this. It’s got to be worth the money.

Anyway, I’ve learned a lot in going through this process. Here are a few of the things I’ve observed:

1. To get consistent results, you have to make sure not only that the car is warmed up, but you also should drive the new ECU for at least 15 minutes before collecting data. Run through the gears a few times before testing. The closer you get, and the finer the changes, the more important this is. I’ve seen the AFR change by 0.3 to 0.4 ratio points and the new tune gets settled in. You want this to happen before you collect data on which to base your next round of changes.
2. Making these changes is as much an art as a science. I used the formulas posted above to get me in the ball park, but that’s all they did. More changes were always needed based on empirical data indicating what the car was actually doing.
3. You have to remember that it takes time for a change in the injector pulse width to be reflected in the AFR reported by the Innovate! Moving from one map cell to the next, the injector pulse changes instantaneously, but the readings do not – there is mixing in the exhaust stream that buffers the readings that you see at the wide band. Also, extra fuel can get deposited on valves and head surfaces and volatilize later to affect combustion mixtures and AFR readings. This is especially true when you are working on 200 RPM wide bands as I was through much of the power curve. Think about how fast your engine moves from 6000 RPM to 6200 RPM at WOT. If you try to load up a single RPM band with fuel to decrease the AFR, you are going to affect other parts of the curve also – or at least that’s how it seems to me. So, the lesson I learned is the importance of making small changes and keeping the fuel map smooth. If I made big changes to a single cell, I would get a whipsaw phenomenon and had the AFR running up and down like nobody’s business. Smooth is good!
4. You should check calibration of the AFR meter often. I found a neat way to do this without removing the O2 sensor to get it into fresh air. Here is what you do: 1) Find a straight stretch of road, preferably with a down-hill slope; 2) Get up to about 45 MPH in 4th or 5th, take your foot off the throttle and turn to ignition key counterclockwise one click to the ACC position (this will turn off the injectors but not the O2 meter which is fed by your cigar lighter); 3) Now depress the gas pedal all the way to the floor – this will allow the engine to pull air in through the throttle body, flushing out the combustion gases; 4) Check your AFR meter – the Innovate! will automatically switch to % oxygen at this super lean AFR. You should see a reading of 20.9% -- the natural level of oxygen in the atmosphere pretty quickly; and 5) IF you see a reading that is more than a couple tenths of a percent different from 20.9%, press the calibrate button and; 6) Release the gas pedal, turn the ignition key one click clockwise to the "On" position (too far and you will engage the starter!), and slowly depress the gas pedal to smoothly take up power again.


Now on to the real work. My initial testing of the Calum SR20DE v.4 showed WOT AFRs in the 12 to 13 range (see graph in the first posting of this thread). Based on what I’ve read, the SR20 does best with WOT AFRs in the low 13s. So, I wanted to lean out these initial ratios to average about 13.1, and I also wanted to try to make them more consistent across RPM. Before starting the WOT revisions, I did some more thorough testing of Calum’s excellent v.4 program. This graph shows 2 separate 3rd gear pulls. Again, you have RPM (black), AFR (purple) and MAF voltage (red) plotted against seconds. One pull is shown in solid lines and one in dotted lines, one is uphill, and one is downhill.


This more careful testing showed that the original tune was giving me lean AFRs up until about 5000 RPM, and then doing a pretty damn good job of producing AFRs in the low 13s above 5000 RPM. To help analyze the situation and diagnose changes that I would be making, I used LogWorks software to make a scatter plot of AFRs against RPMs. Here is the scatter plot for these 2 runs. Note how similar they are to each other.


So, based on this kind of plot, I was able to use vertical lines to partition the graph into RPM ranges that correlated with the RPM ranges in the fuel map from the BIN file. Since the objective was to fine tune AFR at WOT, I worked exclusively on changing the last two columns of the fuel map (flow quotient values 72 and 80).

Here is the basic sequence of the process:

1. By viewing the graph, I decide I want to richen the 2000 to 3000 RPM AFRs from about 14.3 to about 13.1. To change the AFR from 14.3 to 13.1, I need to increase the fuel flow by (14.3-13.1)/14.3=0.08 or 8%.
2. The 3rd row down in the fuel map is labeled “3000 RPM” and covers the range 2000 to 3000 RPM. This is the row that I will work with. The value in this row in Calum’s v.4 bin is 31, which, using the equations in the second post above, would generate a pulse width correction factor of 1.24.
3. 1.08 x 1.24 = 1.34, the new pulse width correction factor. Solving the equations to find the map value that gives a pulse width correction of 1.34, we get a map value of 43 or 44 (it’s actually right in between these two values, which is why I went to 3 decimals eventually).
4. Change the 31 to a 43 in the cells 3000x80 and 3000x72. Feather the values back through the columns to the left to interest with your mid-range values. You are done with this first order change.

As it turned out, empirical testing showed me that this particular change was too large – and I ended up with a final value in these cells of 36 (pulse width correction factor of 1.28). But this is the approach that I used to make my first order changes, then I used the data generated to back off, or make a bigger change as needed. If you set up a spread sheet with the equations, or use my spreadsheet, the calculations are pretty easy to do. Experience will help you decide what changes will be most effective.

So, here is the XY plot comparing 3rd gear pulls using Calum’s v.4 and my latest BIN files (v.4.16). You can see that my objective of leveling the AFRs in the low 13s has been achieved. Only dyno testing will tell if this is where the power will be made. That’s the next step.

2008-01-04 17:59:17
#5
Some very very good info here. Nominate for sticky..
2008-01-04 18:48:34
#6
Awesome writeup. Took me about 3-6 hours of dyno time to really get a feel of how things operated like that, but i was also using a realtime. Man if you were using a realtime instead of having to burn chips you could easily cut your development time in half easily. But thats an awesome writeup on how to tweak the midrange/low end stuff. Its easy to tune top end but that midrange is tough.

When Calum lived here in TN we had talked about renting the dyno for an all day tune session of tuning from idle to full throttle, but never got a chance. You are doing it very very correct. Get your fuel laid out well before hand then start in on the timing to make power. If you get your A/F's to where they should be you can tweak on the ignition table later when you are on the dyno, and figure out where to make power and also do the ultimate fine tuning of fuel.

Great work.
2008-01-04 19:18:09
#7
Tuning on the Dyno

My plan is to use Nissan DataScan Active Test to first richen and then lean out the AFR a couple tenths of a ratio unit to see the effect that this might have on power output across the RPM band. Then I will try to use ROM Editor to tune in the appropriate portions of the AFR curve in the last 2 columns of the map.

Second step will be to first pull one or two degrees of timing advance using Nissan DataScan Active test and see what effect this has. If there is no improvement (i.e., either a loss or no change) I will increase timing advance in 1 degree increments until there is no improvement (or detonation occurs), noting where the timing is best for various portions of the RPM curve. Then I can use this information to edit the last 2 columns of the timing mapfuel .

Sound like a good basic strategy?

Bill
2008-01-04 21:24:52
#8
Sounds ok. Depending on your mods it makes a difference to where and how much power is made. On an ITA motor, .5 increase in compression, 40 over, gasket matching, intake, header, and dump exhaust, we saw that all the way up top, pretty close to stock timing is almost perfect. Remember that when at WOT full load, you are in the upper half of the last column. That is all we tune for on a race car really so a non loaded dyno may show a little different.

And when you do the increments of the base timing only look at like 5500 or 6500 and up. Cause below that you are in different parts of the map. Where are you located? might could get a realtime and tune with that if someone handy is close to you. Thats what Id do if i were you, find someone close by, and say you will cover half their dyno time and will tune them, if they will let you use their realtime. Would go a lot nicer.

We rarely moved the fuel table when we were tuning for power at WOT. I dont think we moved it at all. Only timing, and like i said, for a stockish motor, its all about 4500-6500 where we picked up our big gains in power. All the way to redline was almost stock and saw minimal gains. But it really really matters of what condition your motor is in and what mods. This was on a freshy fresh fresh build, ie we broke it in on the dyno. New parts all around minus block and head... even new cams.
2008-01-04 21:50:31
#9
Sticky material for sure.
2008-01-04 22:43:10
#10
This is great stuff Bill. Let me know when you are planning to go to the dyno. I would like to observe and possibly help out.
+ Reply To Thread
  • [Type to search users.]
  • Quick Reply
    Thread Information
    There are currently ? users browsing this thread. (? members & ? guests)
    StubUserName

    Back to top